


Where a reading replaces a guess.
Two problems every grower knows, and what changes when the farm can measure them: how much water a plant has really used, and which pest is really in the crop.
One plant, weighed all day.
Most farms water by the clock, or by feel. Neither says how much water a plant actually used, or whether the last irrigation reached its roots at all.
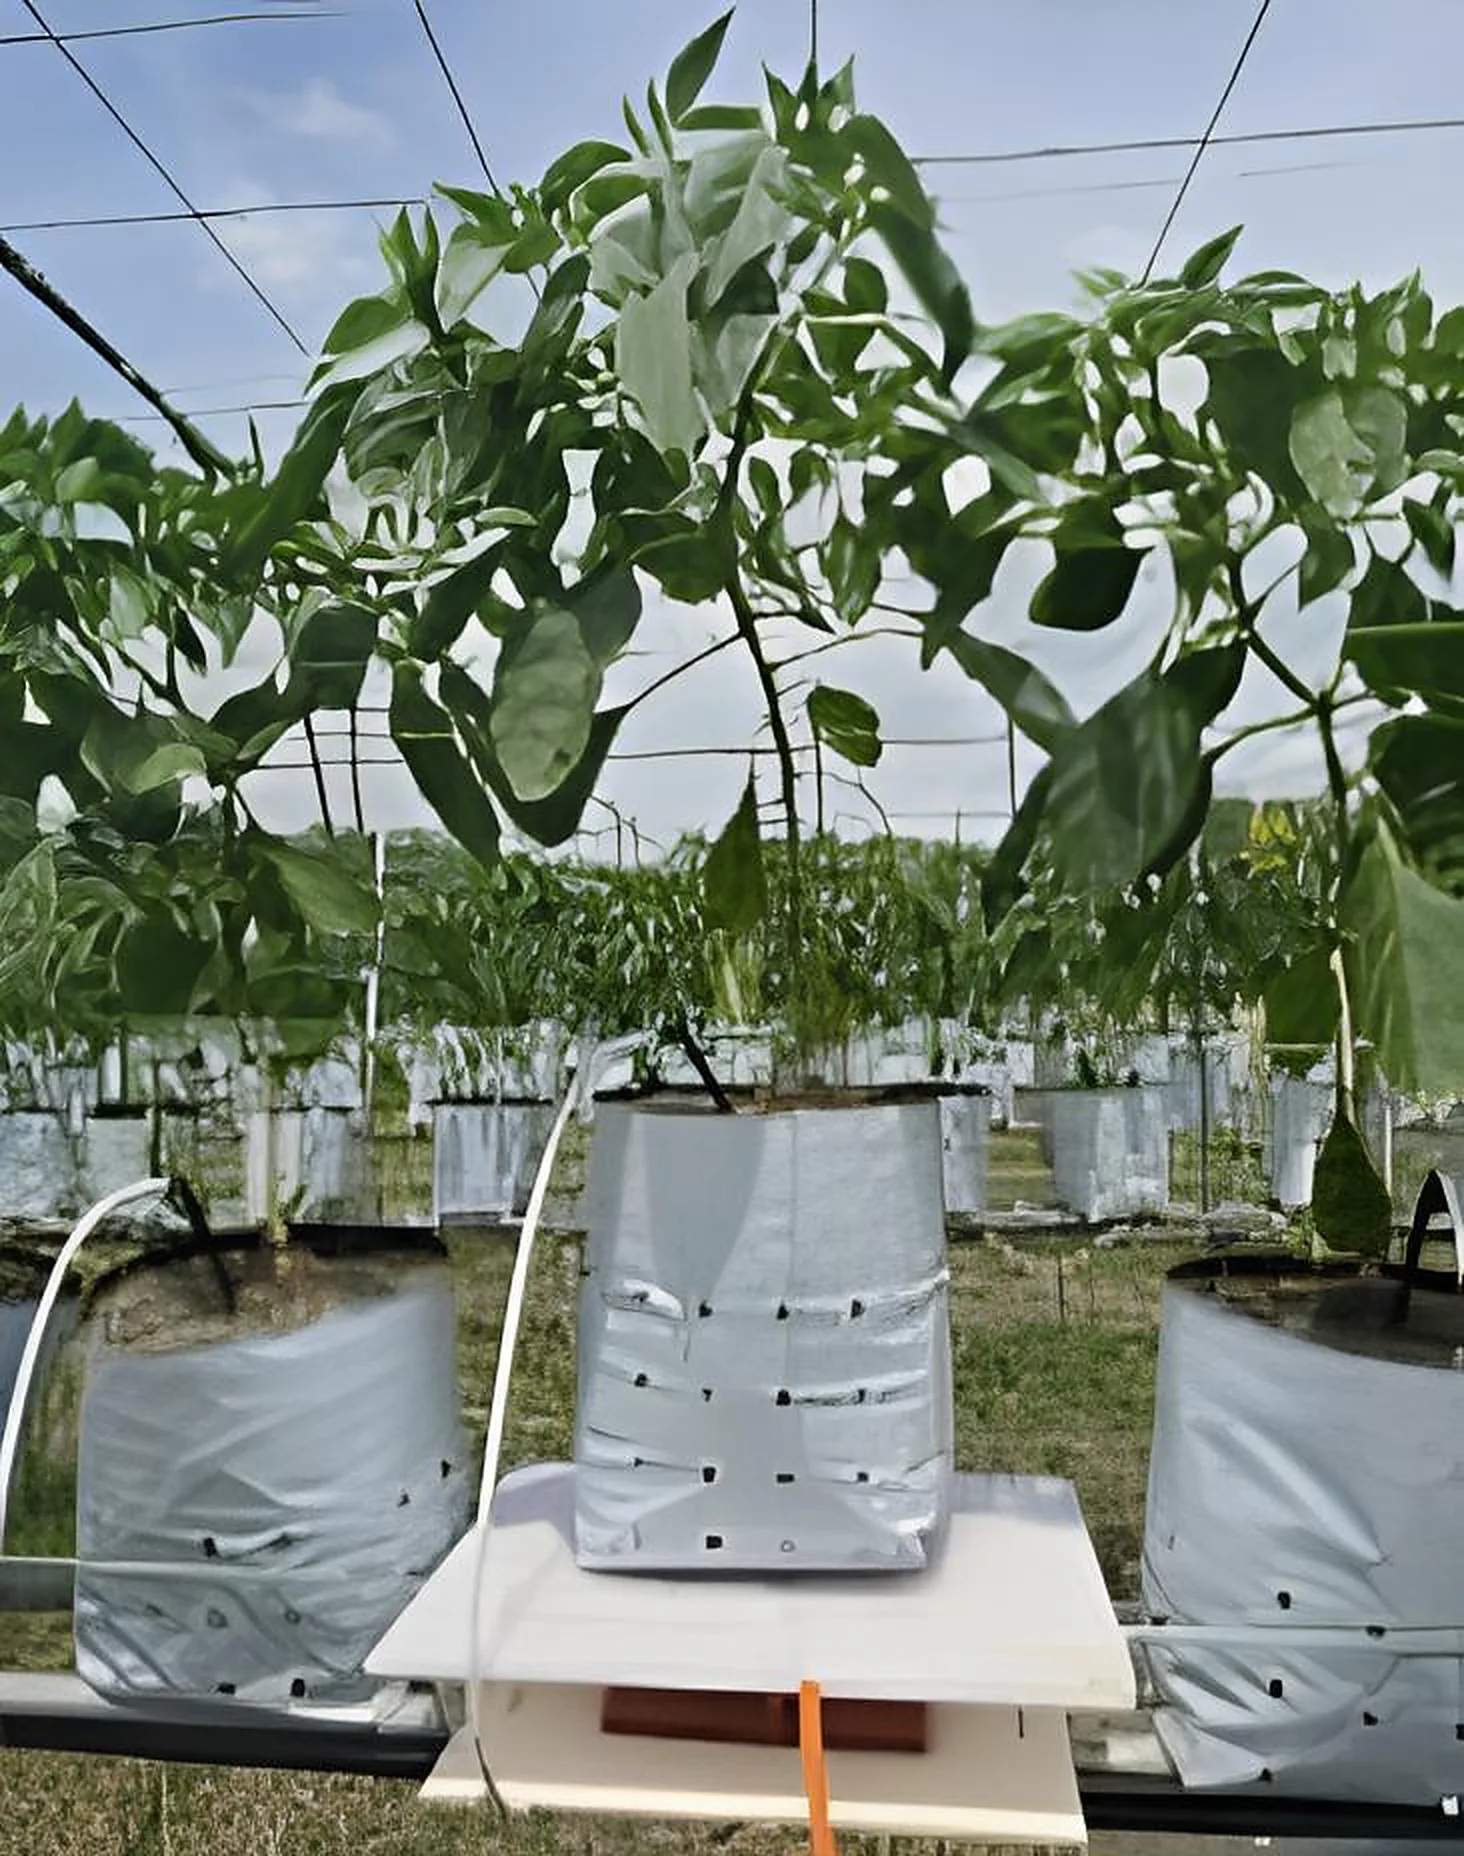
So one polybag stands on a load-cell weighing platform in the row, on the same drip line as the bags around it. The platform weighs everything on it together: the bag, the growing medium, the plant and the water the medium holds. Its reading goes to JPIoT around the clock, beside the soil and weather readings.
One day on the scale.
An example day, read point by point. Every change in the weight has a cause you can name.
Measured load through one example day
4.28kg08:00
Before watering
The starting point: the bag, the medium, the plant and the water left over from yesterday.
4.68kg08:30+0.40 kg
The water arrived
The weight rises by 0.40 kg: the water reached the bag. If the pump ran and nothing rose, a dripper is blocked or the line never filled.
4.56kg09:00−0.12 kg
What it could not hold
What the medium could not hold drains out: 0.12 kg. A little drainage is normal; a lot, every time, is water and nutrient solution running to waste.
4.48kg14:00−0.08 kg
The plant is drinking
Down slowly through the heat of the day: the plant draws water up, and the leaves and the medium give it to the air.
4.36kg18:00−0.12 kg
Today’s water use
Since the drainage stopped, the bag has given up 0.20 kg: roughly what the plant and the air took today. Day after day, that figure is the crop’s real water use.
Four questions, answered with a number.
-
Did the water arrive?
A rise after every irrigation confirms the water reached the bag. A cycle with no rise points to a blocked dripper or a pump that never started.
-
How much was kept?
The rise, less what drains away, is what the medium held. Heavy drainage on every cycle is water and fertiliser running to waste.
-
How fast is it drinking?
The slope between irrigations is the day’s water use. Read beside the weather station, a hot day falls faster than a cloudy one.
-
Is it growing?
Over the weeks, the weight just before the morning watering tends to creep up as the plant grows. Read with the soil moisture, it is one way to follow growth.
- Less water wastedIrrigation sized to what the plant used, not to what the schedule says.
- Fertiliser stays in the bagLess drainage means less nutrient solution lost from the root zone.
- Problems found earlyA blocked dripper shows up as a missing rise, the same day.
- Decisions with a number behind themIrrigation and fertigation schedules reviewed against what happened in the bag.
Spraying blind, and the trap that sees.
Before, the only safe-looking choice was to spray. Without knowing which insect was in the crop, or how many, farmers sprayed every block on a schedule, often with a broad product, and much of it landed where there was nothing to kill.
 Illustration
Give the farmer the one thing spraying needs: knowing what is there.
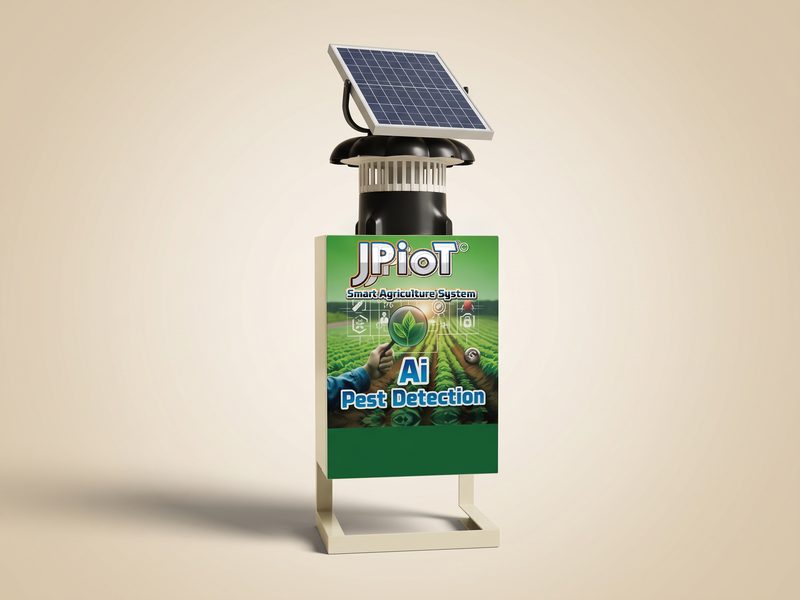
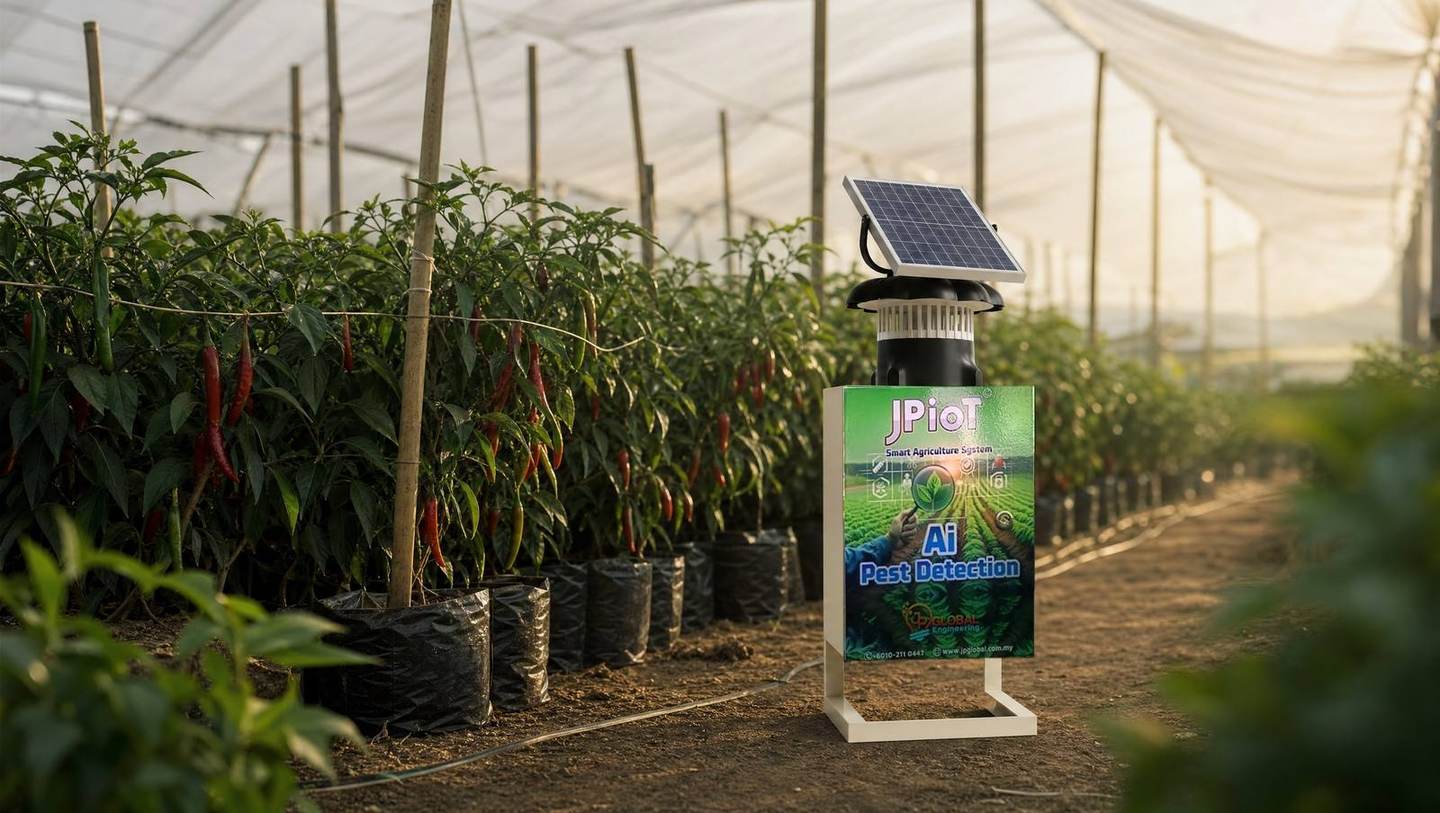
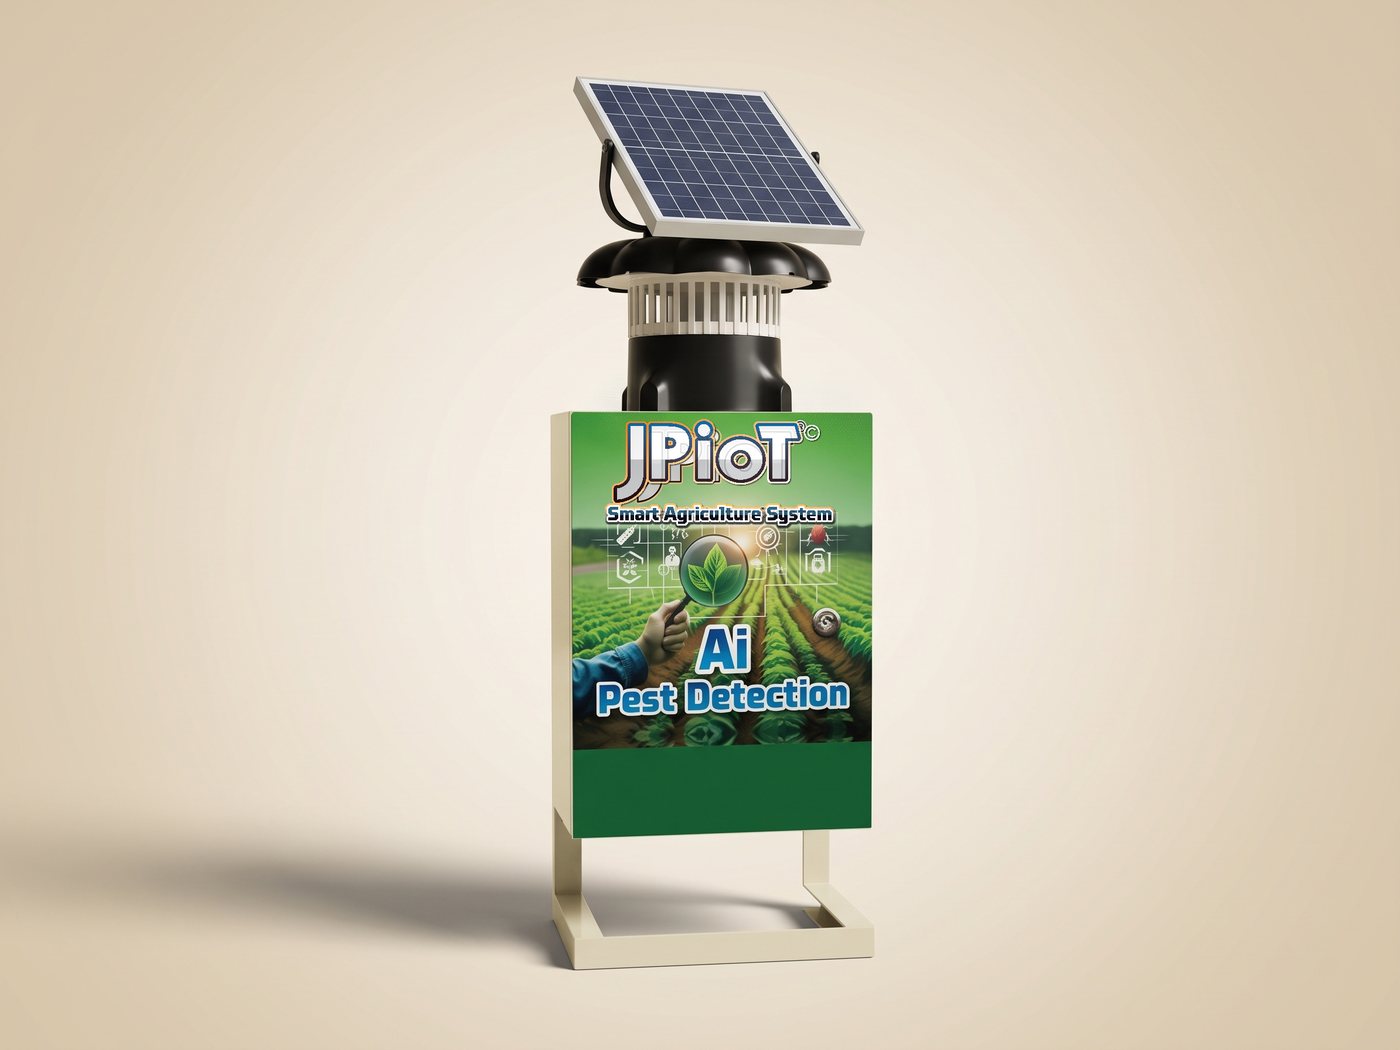
JP Global built AI Pest Detection to answer the questions a sprayer never could: which insect, how many, and where. A smart trap stands in the crop and does the looking.
- Draw them inThe light brings flying insects to the trap, and the plate holds them.
- SeeA camera records the plate, day and night, on solar power.
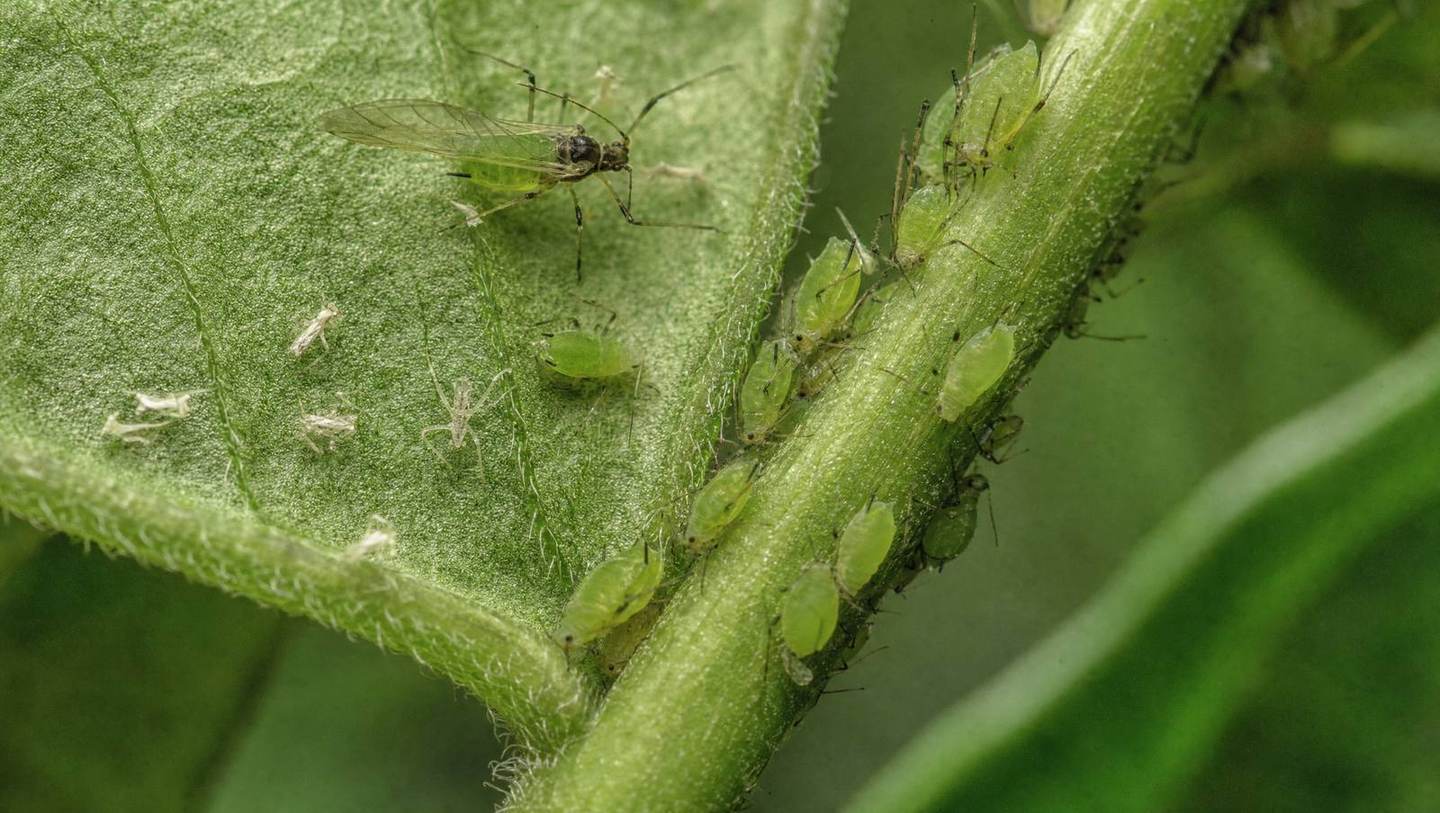
- Name and countThe AI model names each insect, such as aphids, whiteflies, thrips or fungus gnat, or a target set for your crop, and keeps the tally.
- Tell youThe count, block by block, opens on phone and computer, with an alert when it climbs.
The same four weeks, two ways.
Three blocks, four weeks. Switch between spraying on a schedule and spraying on what the trap found.
| Block | Week 1 | Week 2 | Week 3 | Week 4 |
|---|---|---|---|---|
| Block A | ?Sprayed; pest unknownWhitefly4 | ?Sprayed; pest unknownWhitefly9 | ?Sprayed; pest unknownWhitefly31sprayed | ?Sprayed; pest unknownWhitefly7 |
| Block B | ?Sprayed; pest unknownAphids2 | ?Sprayed; pest unknownAphids3 | ?Sprayed; pest unknownAphids2 | ?Sprayed; pest unknownAphids4 |
| Block C | ?Sprayed; pest unknownThrips3 | ?Sprayed; pest unknownThrips22sprayed | ?Sprayed; pest unknownThrips6 | ?Sprayed; pest unknownThrips4 |
12 sprays. Every block, every week, with a broad product, because nobody knew what was there.
2 sprays. Block C for thrips in week 2 and Block A for whitefly in week 3, each with the product for that pest, once the count passed your threshold. Block B, with a few aphids, was left alone.
Illustrative exampleHow much pesticide is saved depends on the crop, the pest pressure and the farm.
- Which pest→ the product meant for it, not a broad one
- How many→ whether to spray at all, against your threshold
- Where→ the block that needs it, not every row
- Which way→ whether the treatment worked: the count should fall
- Less pesticideThe affected block at the right time, not the whole farm on a schedule.
- The right productChosen for the pest that is actually there.
- At the right momentThe alert arrives while the problem is still small, before the damage shows.
- A record for every seasonPests by plot and by season, for you and for your officer.